

By Babak Arjomand
03 Mar 2026 · 4 Min Read
To uncover why users are failing to convert, we must move beyond the standard reports. We need to treat the GA4 property as a diagnostic environment. By interrogating the nuances of user behaviour through Explorations and event sequencing, we can identify the specific friction points - the "conversion killers" - that are eroding your ROI. However, there is a caveat: you cannot diagnose what you haven't measured. If you are relying on an "out-of-the-box" implementation, the evidence you need likely doesn't exist in your reports yet.
The usual suspects: Common 2026 killers.
Before interrogating the data, we must know what we are looking for. Modern friction is often found in:
- Technical friction: Mobile-first instability or poor Core Web Vitals (LCP/CLS) that cause users to bounce before the tracking even initialises.
- Cognitive load: Forms that demand too much "thinking" or choice paralysis in the navigation.
- Trust gaps: High drop-offs at the point of "Price Resistance" usually indicate missing social proof or hidden shipping costs.
1. Funnel exploration: Visualising the logic of drop-off.
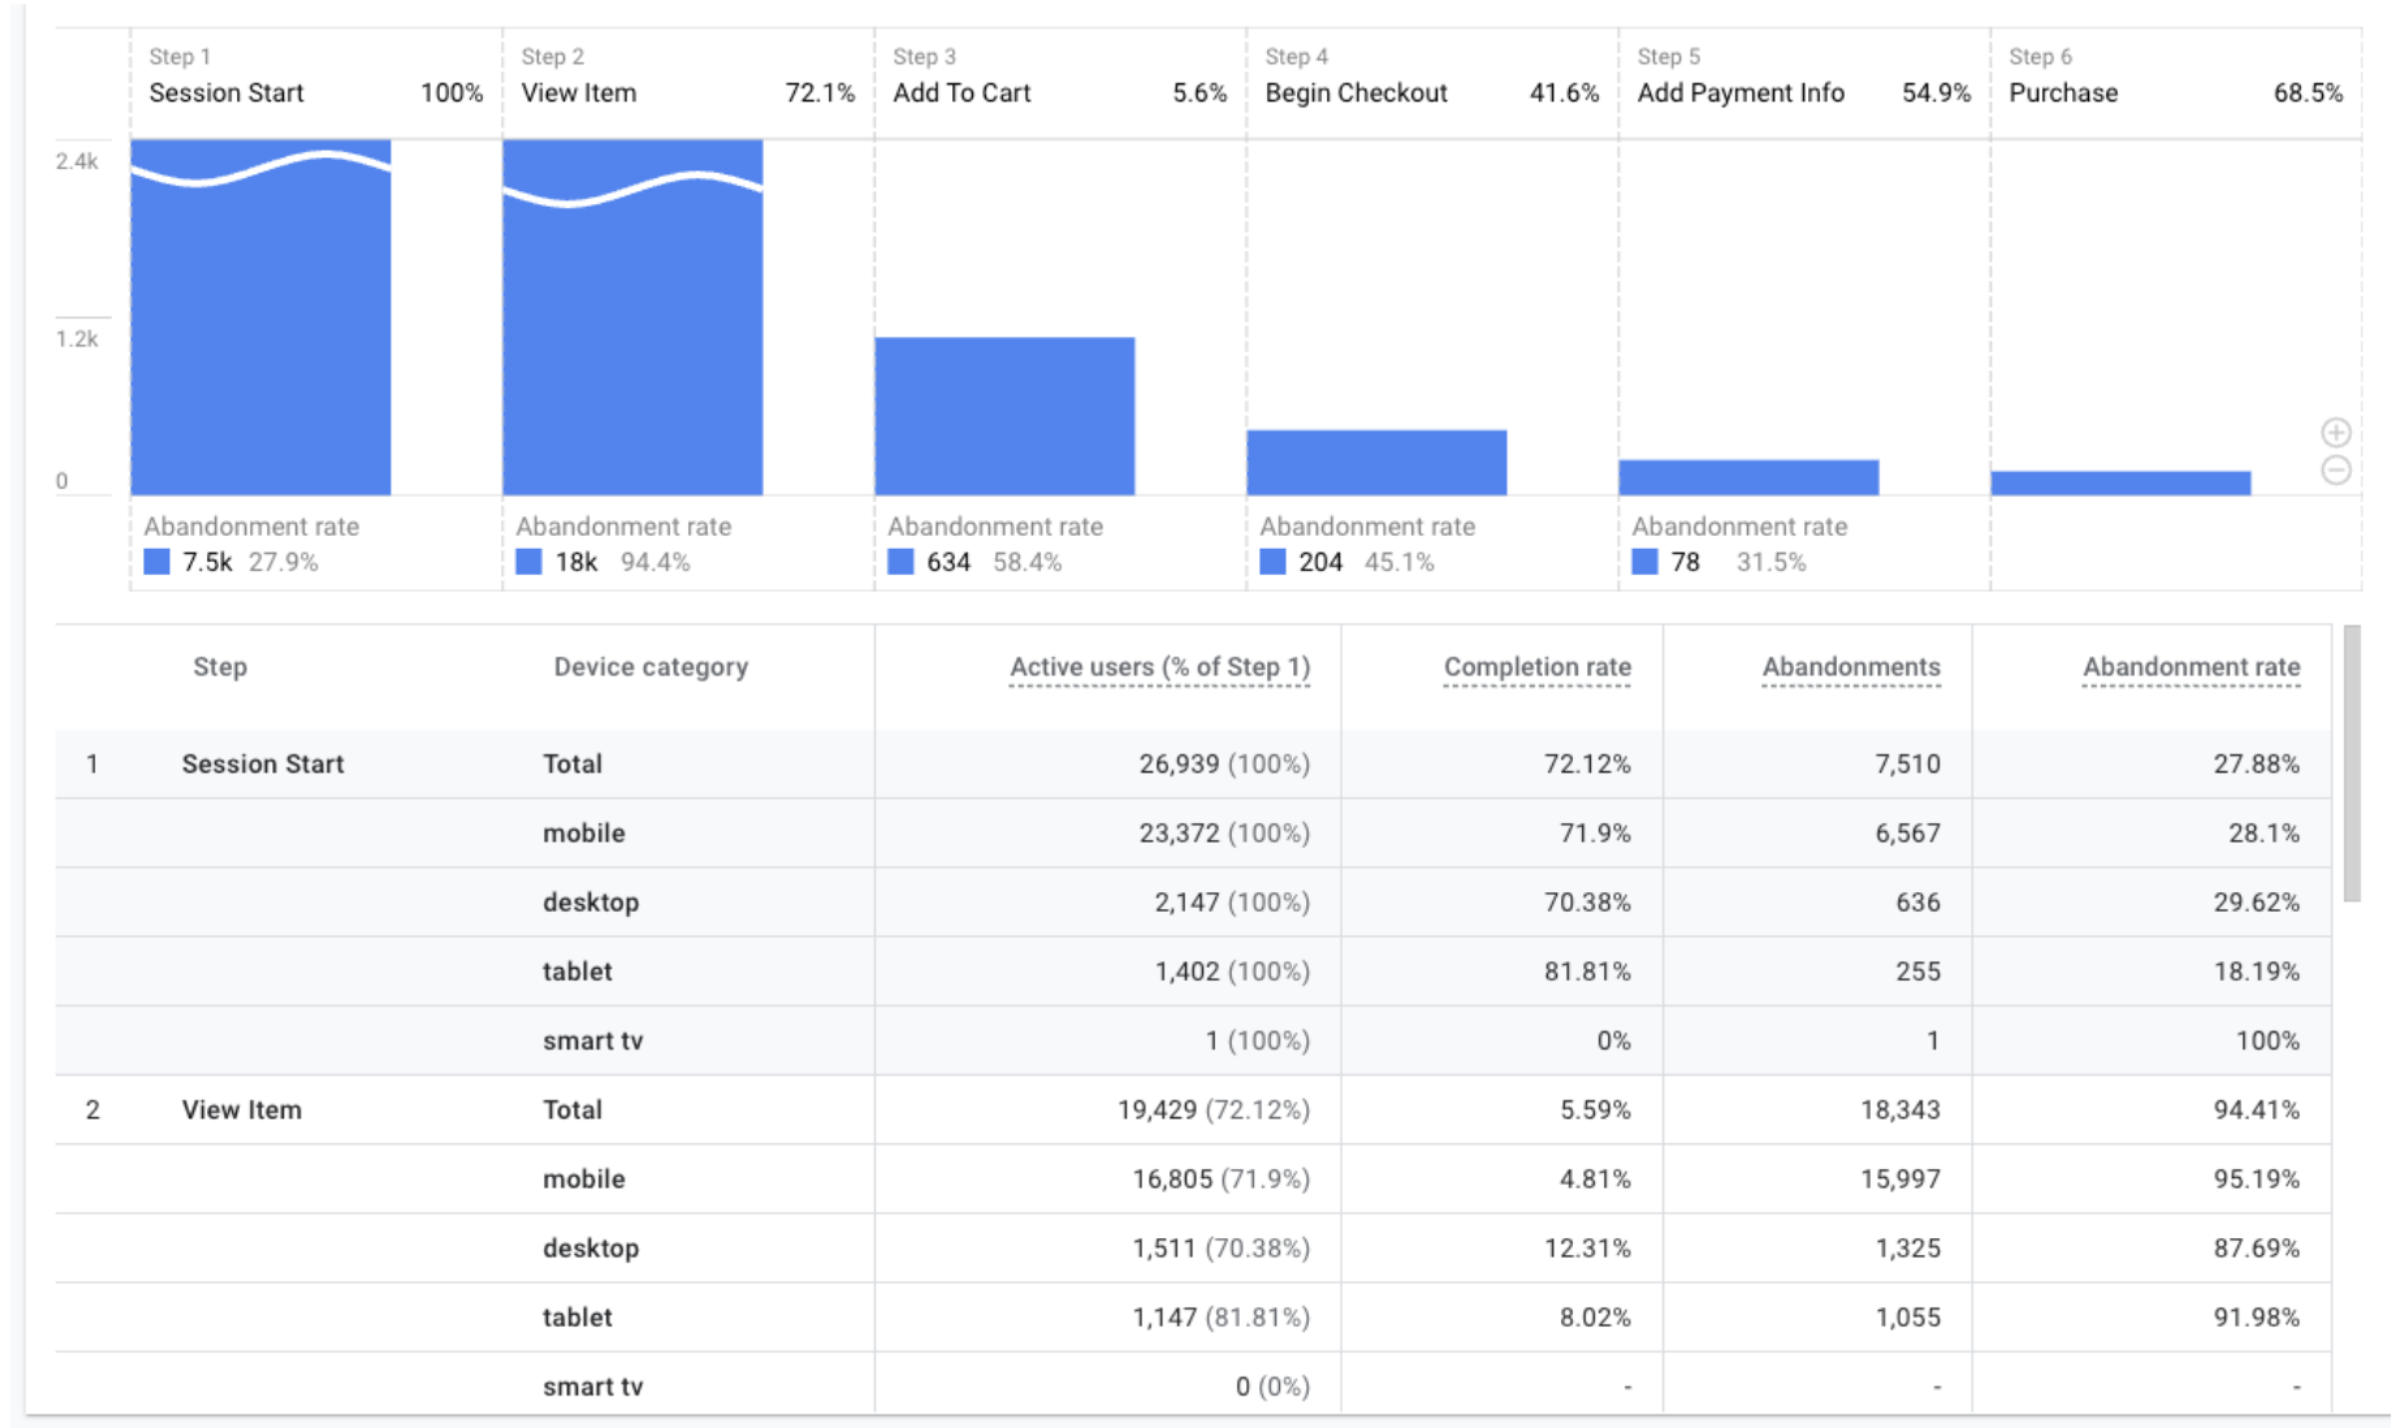
The Funnel Exploration is the most potent tool for identifying where the user journey breaks down. In a world of non-linear paths, the funnel allows us to impose a logical structure on the chaos to see exactly where the "leaks" occur.
- Sudden vs. Gradual Attrition: When building a custom funnel, pay close attention to the slope of the drop-off. A gradual decline is often a sign of natural intent filtering. However, a sudden, vertical drop—for example, between begin_checkout and add_payment_info—is a signal of high technical friction.
- The Device Dimension: Always break your funnels down by Device category. In 2026, "responsive" design is the bare minimum. If your desktop conversion rate is 4% but your mobile rate is 0.5%, the data is signaling a fundamental failure in the primary browsing environment for your users.
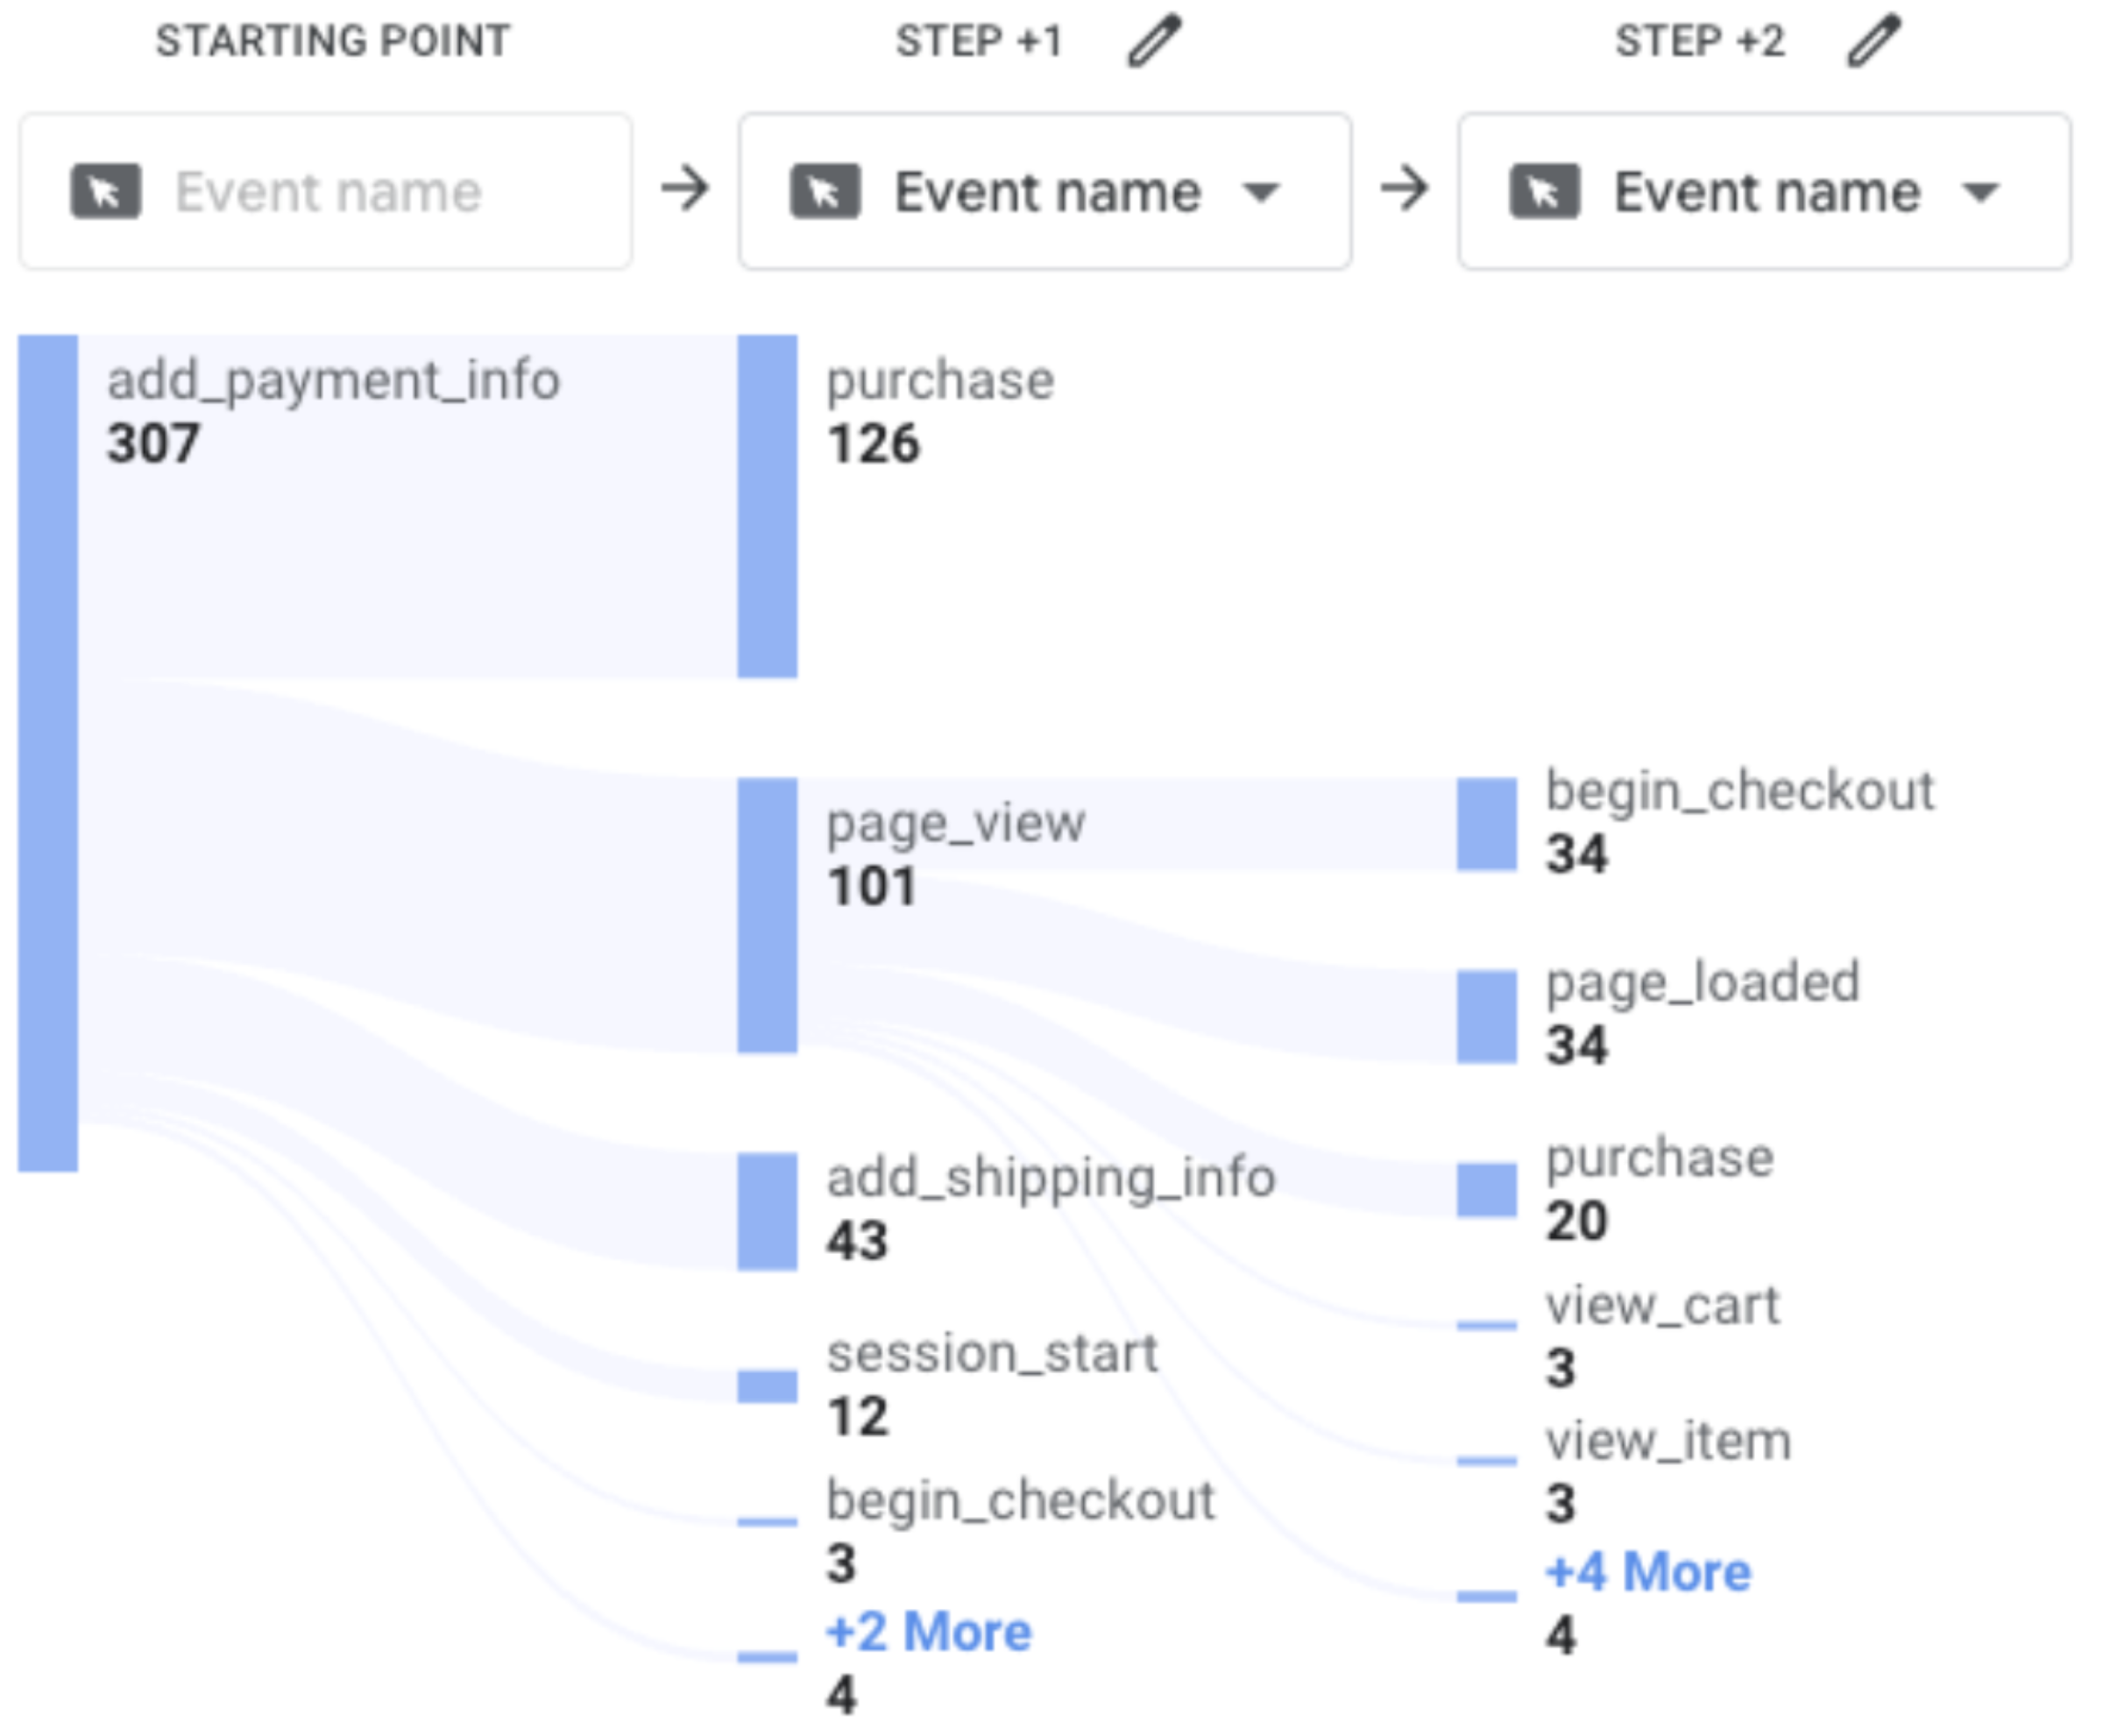
2. Path exploration: The "why" behind the wander.
If a Funnel tells you where users left, Path Exploration suggests what they were doing instead. By utilising the "Start over" feature with a "Backward path" from a failure event (such as a cart abandonment), we can see the distractions that pull users away from the goal.
- The FAQ Detour: If a significant node in your path shows users jumping from the checkout back to "Shipping & Returns," your checkout has failed to provide the necessary reassurance.
- Looping Behaviour: Watch for nodes that oscillate between two pages. This "looping" is a clear signal of cognitive load; the user is stuck in a logic trap, unable to find the information or the button required to change state.
3. BigQuery forensics: Leveraging SQL for advanced analytics.
While the GA4 interface is a capable tool for trend analysis, the "Data Detective" eventually hits the ceiling of the UI’s limitations. To move from observing session-level snapshots to understanding the full gravity of the user journey, we must move into BigQuery.
Accessing the raw event-level data allows us to bypass the constraints of standard reporting and perform high-resolution forensics. For example, standard reports can tell you that a user abandoned their cart, but SQL allows us to interrogate with more granularity, such as recovery time. By querying the raw event data, we can calculate the exact interval between an abandonment (begin_checkout) and a subsequent purchase.

Beyond fixing friction, we must also identify value. While the GA4 interface utilises data-driven attribution by default, it is still inherently focused on the touchpoints preceding a conversion. Using BigQuery, we can perform First-Touch Analysis to see which specific products act as "gateways" to your most valuable customers. You may find that while Product A has a lower immediate conversion rate than Product B, the users who first encounter Product A go on to have a 300% higher Lifetime Value (LTV). This insight is transformative, and often overlooked, or simply unachievable without the correct BigQuery setup.
4. Engagement mismatches: Identifying silent blockers.
We must look at the relationship between Average engagement time and Key event rate. A mismatch here often points to a "silent blocker", an issue that doesn't cause a bounce, but prevents a conversion.
- High engagement, no progression: If a page has a high dwell time but a 0% progression rate to the next funnel step, the user is likely "stuck" rather than "interested." They are consuming content but cannot find the bridge to the next stage.
- User scoping vs. event scoping: A conversion killer often looks different for a returning customer than a first-time visitor. By applying User-Scoped segments to your engagement reports, you can see if your site is failing to reward loyalty or failing to educate newcomers.
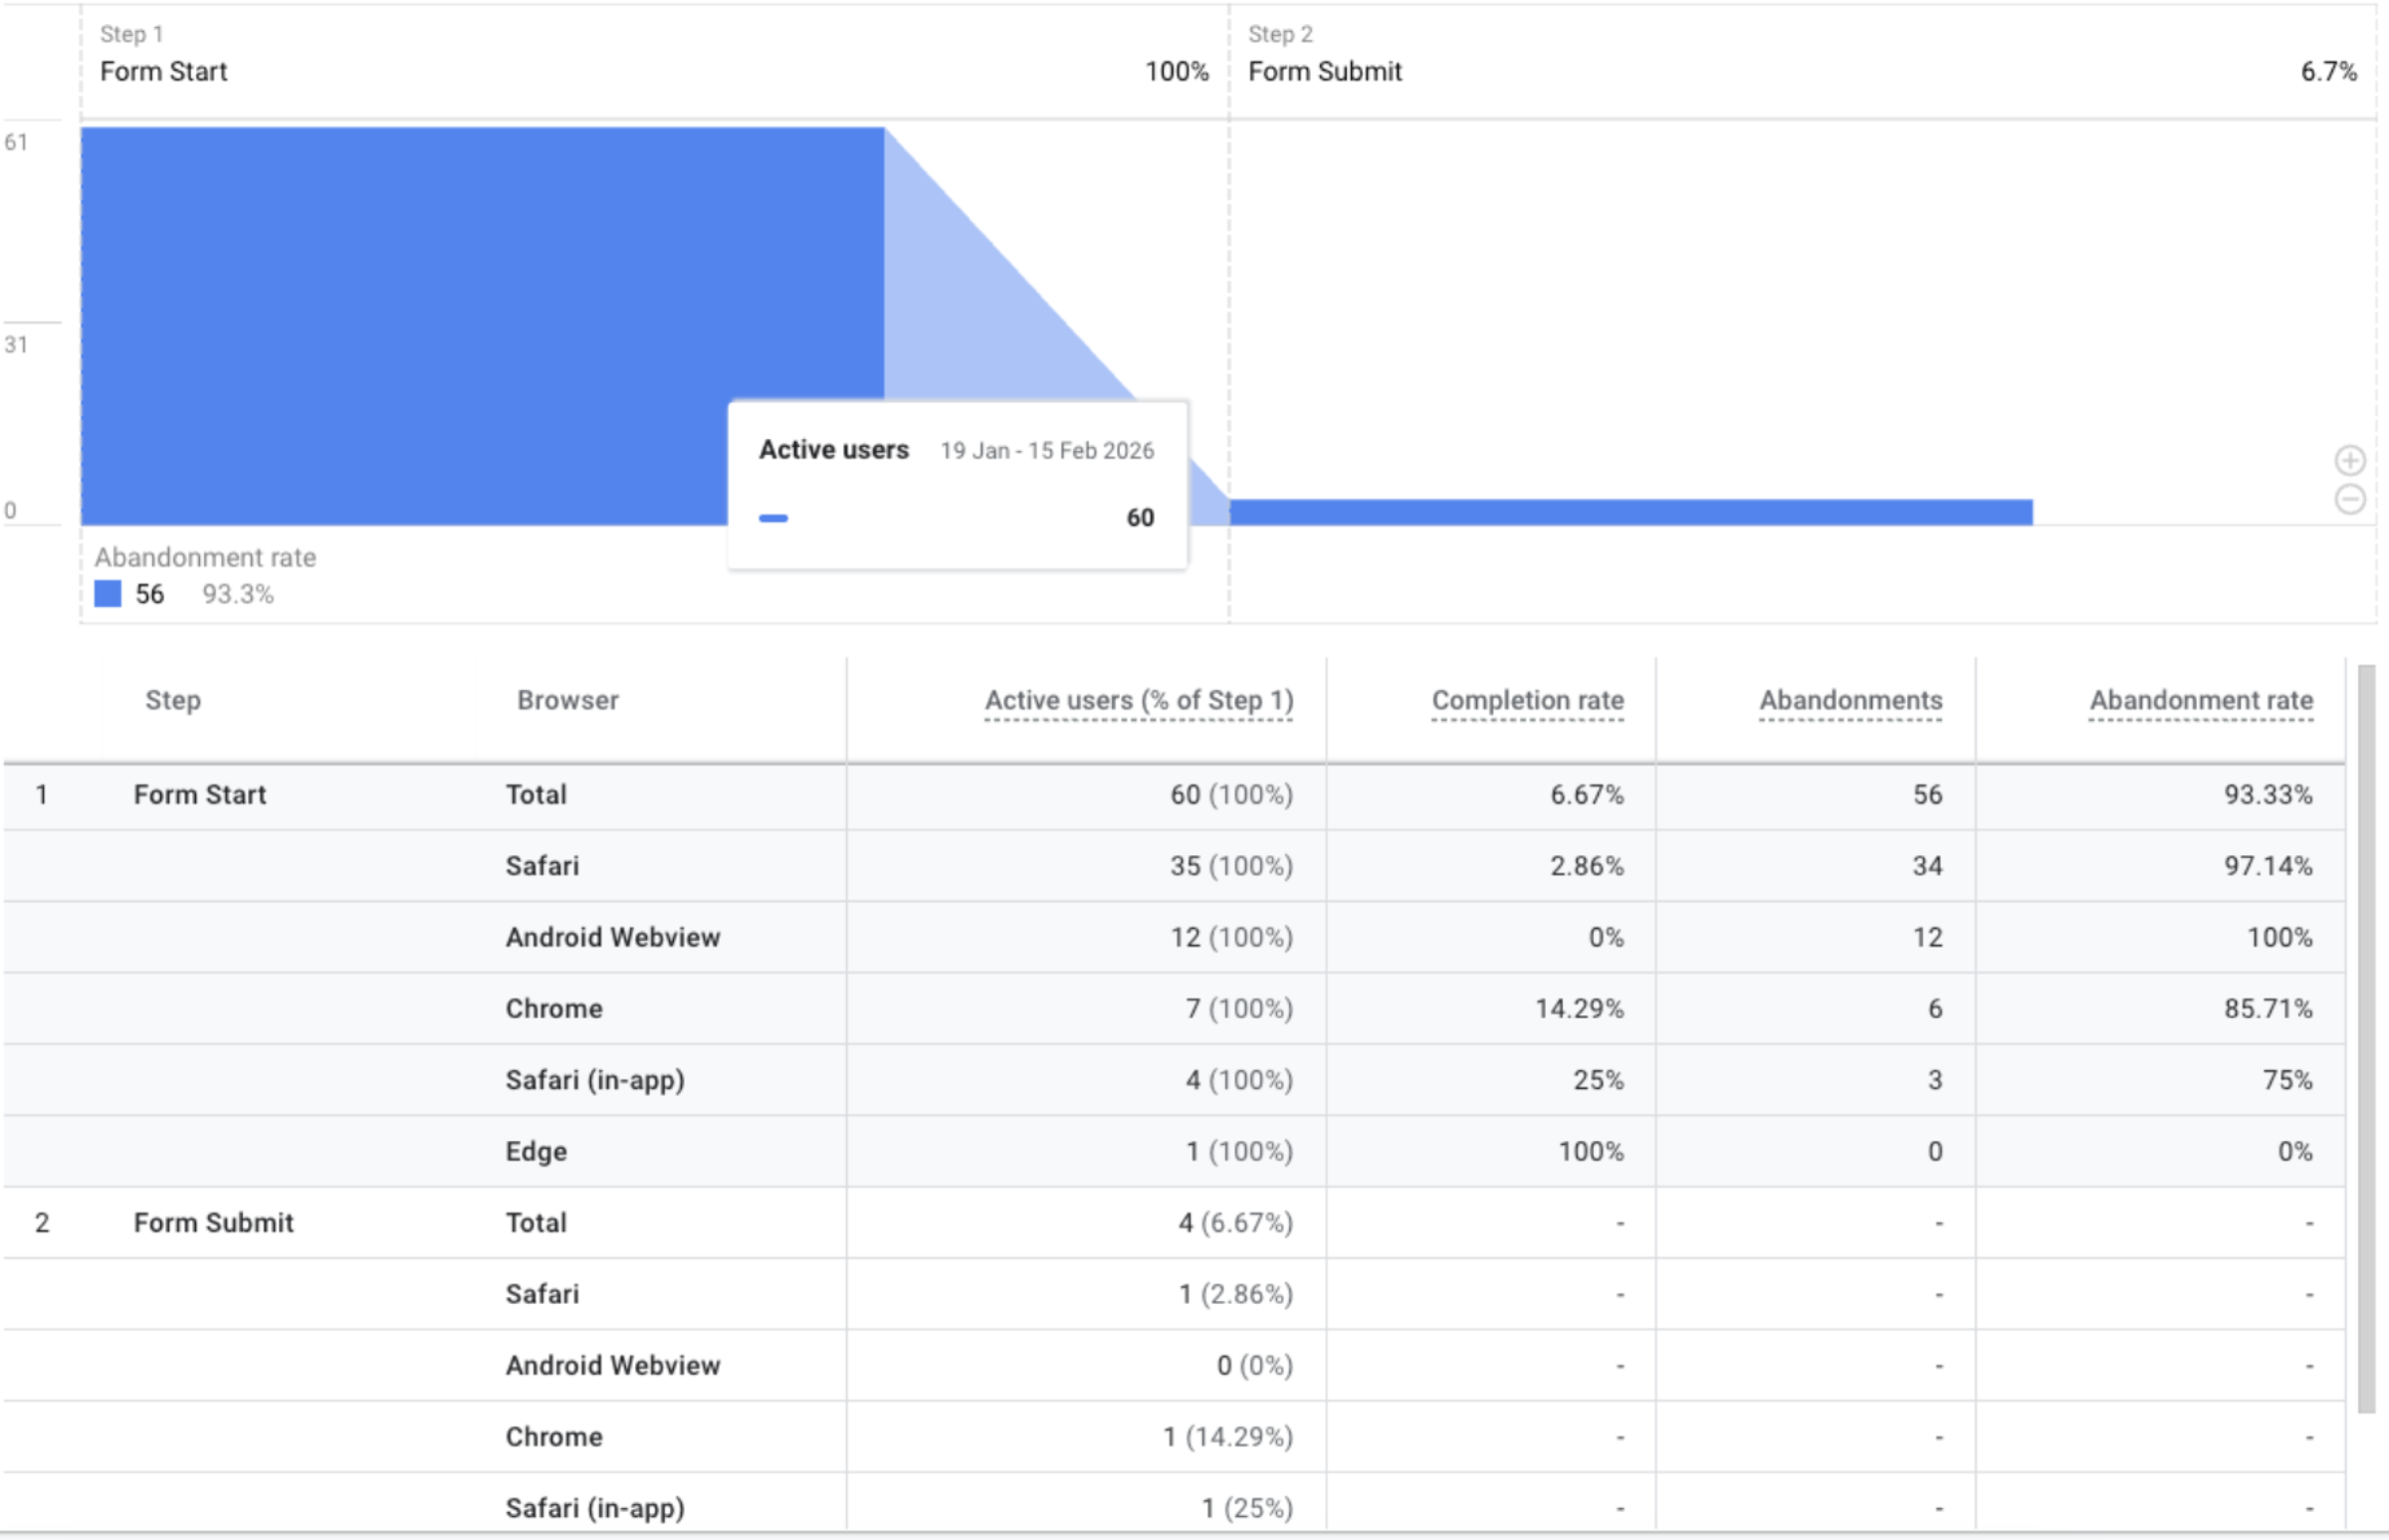
5. Event sequencing: Intent vs. execution.
Data integrity is about more than just tracking clicks; it's about tracking the intent behind the click. By comparing event pairs, we can spot where the technical implementation or the UI is failing the user.
- form_start vs. form_submit: A massive delta between these two events suggests a form that is either too intrusive or technically fragile on specific browser versions.
- add_to_cart vs. begin_checkout: If users are adding items but never initialising the checkout, there is likely a friction point in the "Cart Drawer" or unexpected costs (shipping/tax) being revealed too late in the process.
6. Consent, behaviour modelling and anomalies
We cannot discuss GA4 without addressing Consent Mode. With the shift toward privacy-centric, modelled data, your "estimated" conversions are only as reliable as your technical implementation.
- Garbage in, garbage out: If your consent banner is misconfigured, you aren't just losing data, you are feeding "garbage" into GA4's machine learning models.
- Automated insights: Use GA4’s AI-driven anomaly detection. Those small gold circles in your trend lines are your first alert system. A sudden drop in conversion rate detected by the AI often points to a "broken" payment gateway or a botched site update.
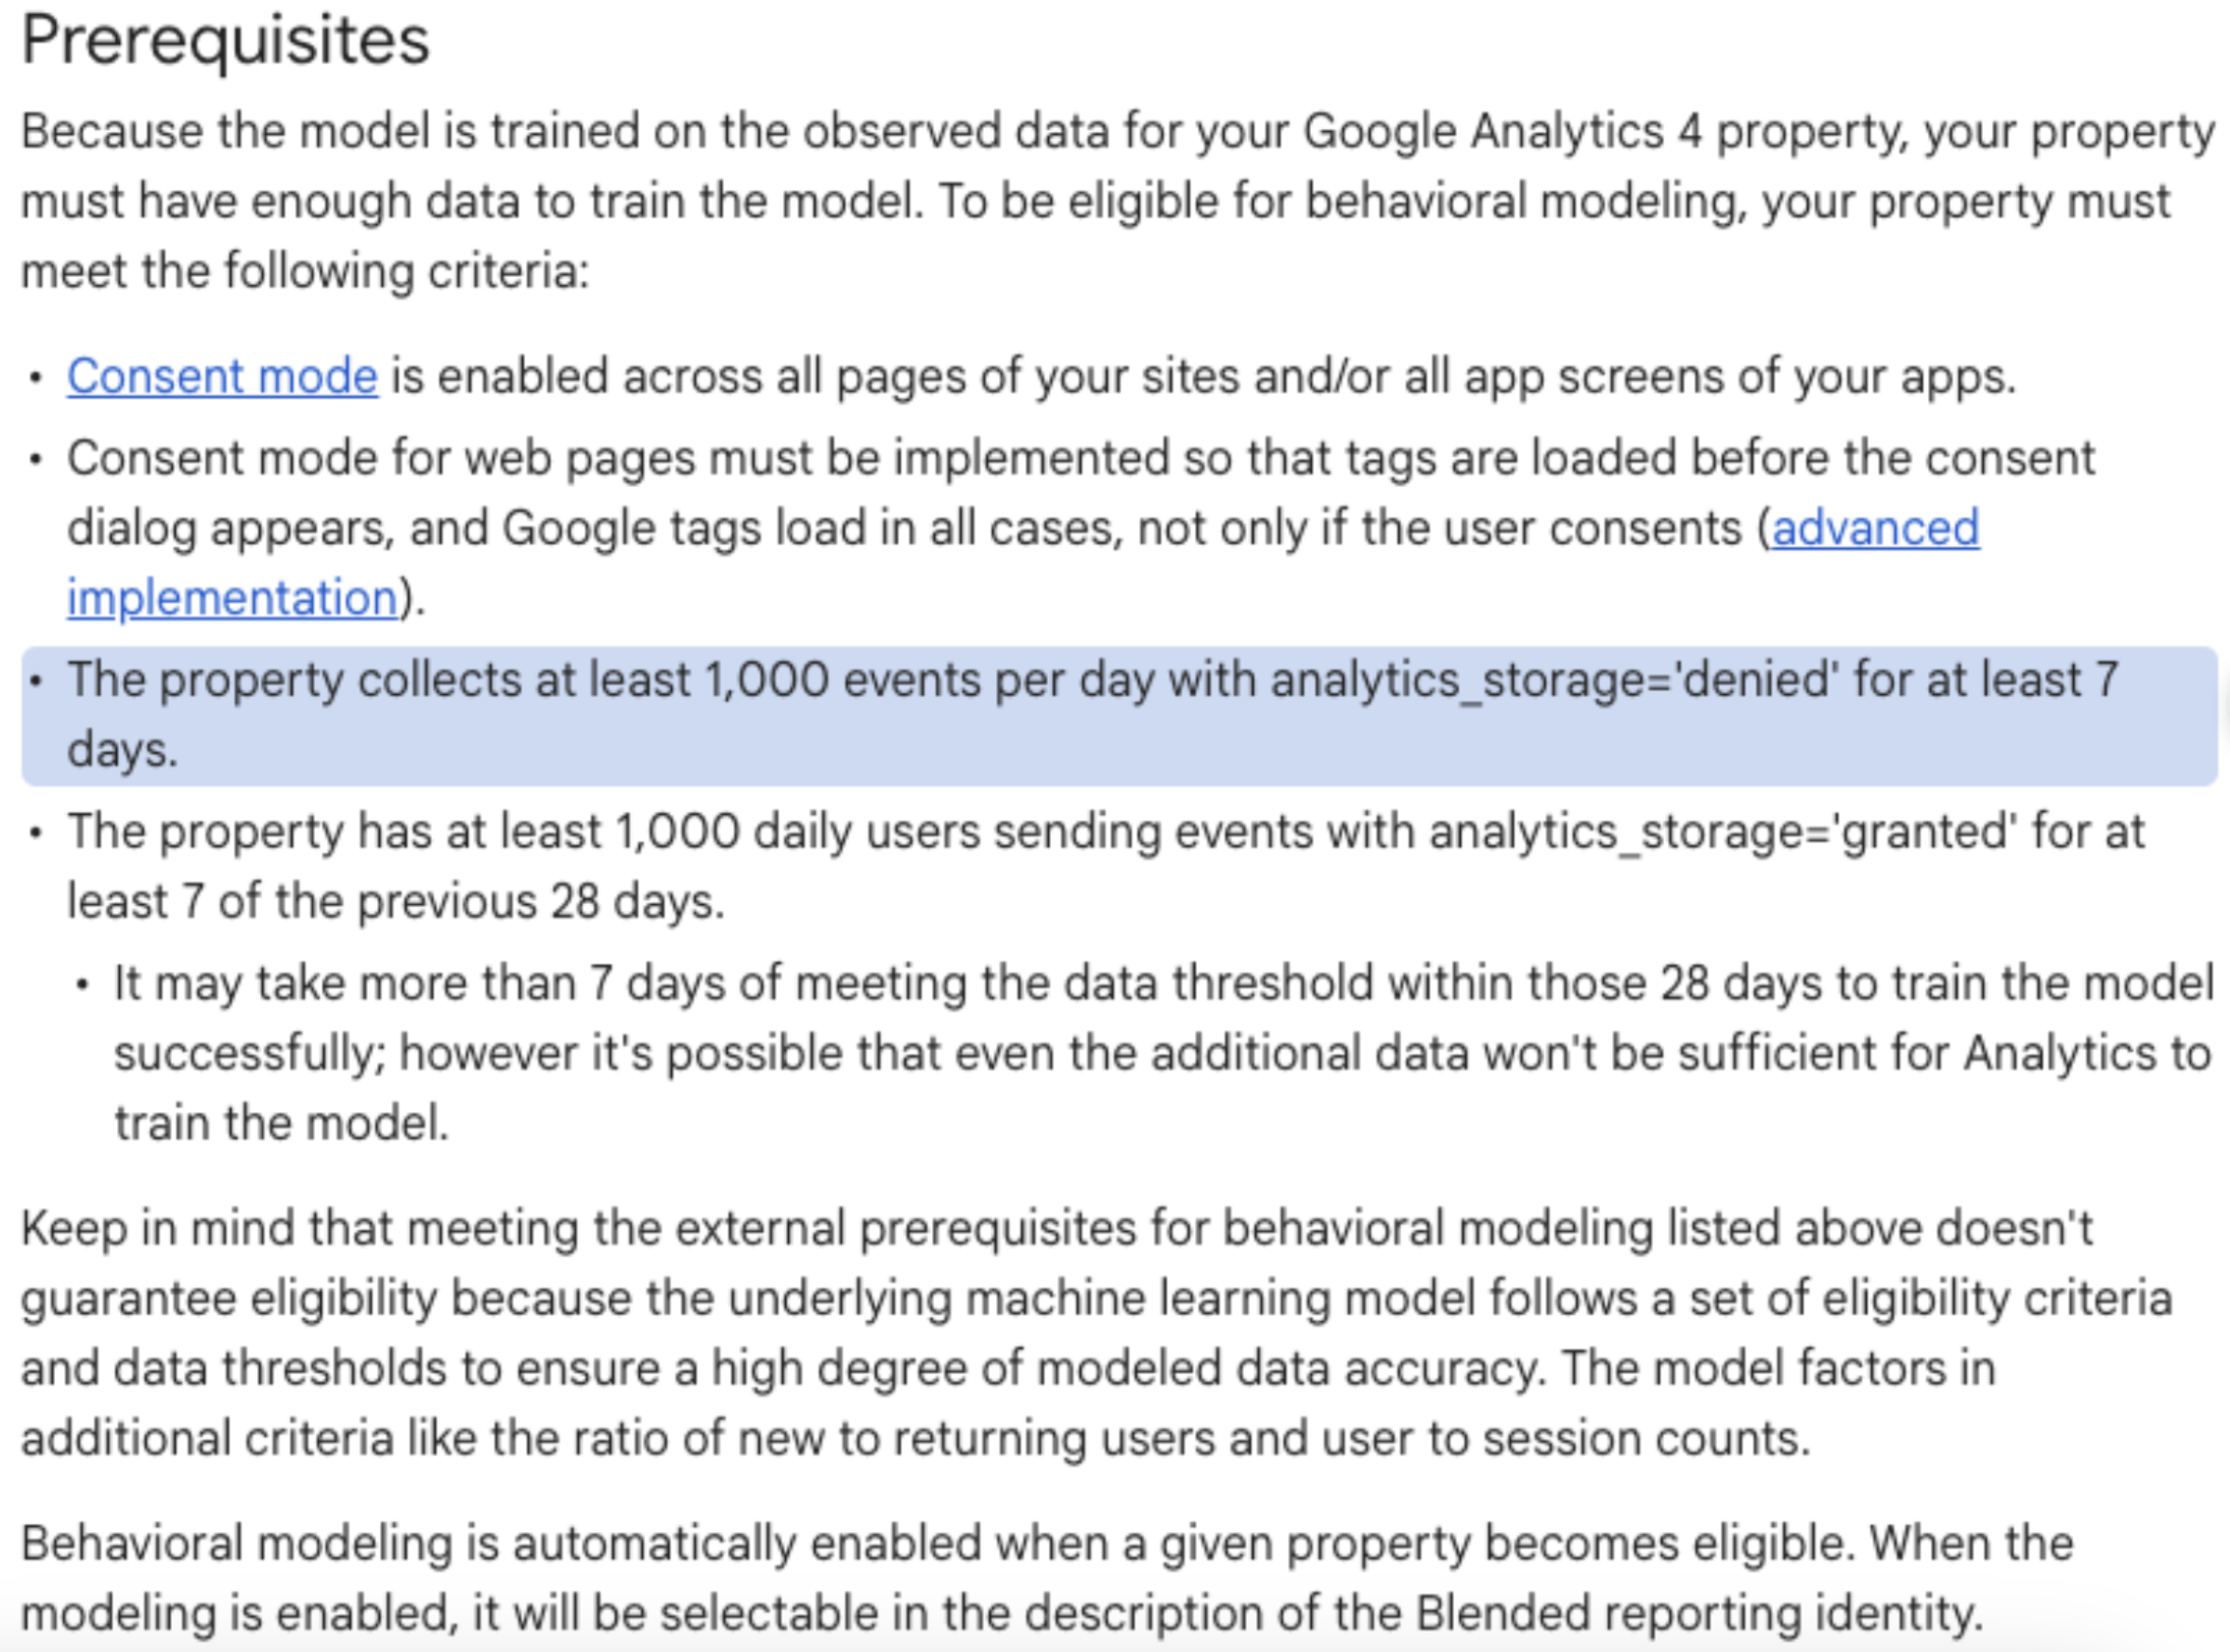
- The modelling threshold: Behavioural modelling isn't a silver bullet that works for everyone. To qualify for GA4's modelling, your property must meet strict prerequisites, typically 1,000 daily events with denied consent for at least 7 days. If your implementation is sloppy or your volume is low, you aren't getting "modelled data"; you are simply looking at a fractured, incomplete dataset.
7. Segment overlap: Profiling the anomaly.
A crucial diagnostic step involves the Segment Overlap tool. By comparing "Purchasers" vs. "Non-Purchasers" against dimensions like browser or traffic source, we can spot campaign-specific breakages. For instance, if high-spend traffic from a specific campaign results in 0% conversion, the landing page likely suffers from a technical mismatch with that audience.
The invisible barrier: Why standard GA4 isn't enough.
Identifying these friction points is only the first phase. The data may tell you the checkout is broken, but it won't tell you how to fix the underlying conflict or the bias causing the drop-off.
Furthermore, the reports mentioned above, Pathing, Funnel Explorations, and Event Sequencing, are only as accurate as your underlying tag architecture. Most "out-of-the-box" GA4 setups fail to capture the granular events required to actually see these conversion killers. Without an Advanced GA4 Build, you are essentially flying blind, trying to solve a puzzle with half the pieces missing.
Is your data foundation robust enough to surface these insights? Don't let your marketing budget drain into a leaky funnel. At Bind Media, we specialise in the technical precision of advanced GA4 builds and deep-dive audits that turn fragmented data into a clear roadmap for growth.
Get in touch with Bind Media today for a GA4 Audit or Advanced Build.